Thursday, December 6, 2012

Monday, October 22, 2012
K12Online: 7 Degrees of Connectedness
This week the K-12 Online Conference kicks into high gear with video presentations that cross four strands. If you know of any teachers who could use some mid-semester encouragement or motivation, please point them to the conference.
My presentation is based on 7 Degrees of Connectedness, and will go live in the "Getting Started" strand on Wednesday. This video was produced with the support of a few of my online colleagues whose stories weave in and out of the narrative. In short, my talk invites educators to foster authentic relationships by connecting with others through a range of social media tools.
What is it for you that leads you to pay closer attention to the learners in your network? Do you feel close to those colleagues you interact with, even if you've never met? Are you more attuned to those people whose voices are amplified because you met at a conference; exchanged stories; shared a meal? As our connections grow with online colleagues, we may find ourselves in qualitatively distinct relationships with co-learners. By sharing our ideas alongside details of our personal lives, we have a tendency to become more and more familiar to one another. Augment these connections with voices and imagery, and it can lead to deeper and more fulfilling connections. In this presentation Rodd Lucier (AKA The Clever Sheep), invites you to walk along with a few of his colleagues who join him in reflecting on how modern tools are impacting our online relationships. The concept of '7 Degrees of Connectedness' is introduced as one way to qualify the relationships we foster with online colleagues.
Presenter: Rodd Lucier Location: Komoka, Ontario, Canada
My presentation is based on 7 Degrees of Connectedness, and will go live in the "Getting Started" strand on Wednesday. This video was produced with the support of a few of my online colleagues whose stories weave in and out of the narrative. In short, my talk invites educators to foster authentic relationships by connecting with others through a range of social media tools.
What is it for you that leads you to pay closer attention to the learners in your network? Do you feel close to those colleagues you interact with, even if you've never met? Are you more attuned to those people whose voices are amplified because you met at a conference; exchanged stories; shared a meal? As our connections grow with online colleagues, we may find ourselves in qualitatively distinct relationships with co-learners. By sharing our ideas alongside details of our personal lives, we have a tendency to become more and more familiar to one another. Augment these connections with voices and imagery, and it can lead to deeper and more fulfilling connections. In this presentation Rodd Lucier (AKA The Clever Sheep), invites you to walk along with a few of his colleagues who join him in reflecting on how modern tools are impacting our online relationships. The concept of '7 Degrees of Connectedness' is introduced as one way to qualify the relationships we foster with online colleagues.
Presenter: Rodd Lucier Location: Komoka, Ontario, Canada
Tuesday, October 2, 2012
Increase the Achievement Gap
The constant flood of articles and system goals that proport to 'close the achievement gap' has always left me a bit dismayed. Is the 'gap' really a problem that should be addressed?

My take is that we should actually aspire to the goal of increasing the achievement gap. We would be successful should our highest flyers manage to reach beyond the expectations of those who imagine and publish learning outcomes. Of course, we should celebrate the wonders of our most amazing students, not at the expense of other learners, but while we continue to help all learners achieve to their fullest potential. It's just that those with the greatest of potential, are rarely challenged to race beyond what most of their peers are capable of.
But too often, it's the gap that matters. While ignoring or impeding the learning of our brightest students is one way to decrease the achievement gap, there is another 'mathematical' way to bridge the difference: Play the shell game.
 Secret Tips on Closing the Gap
In the province of Ontario, students enter either academic or applied streams of courses in grade 9. The academic courses are designed for kids who got the 'I do school well' gene; while the in theory, the applied courses are meant for learners who do better with concrete learning experiences. Locally developed courses are provided to meet the needs of students with functional deficits or intellectual challenges well beyond those of the average student.
When it comes to measuring achievement in mathematics, the Education Quality and Accountability Office or EQAO, tests HS students in grade 10. The results are reported for both academic and applied streams board by board, and school by school . So each school gets a report highlighting the percentage of learners who were successful in each type of course.
Want to 'reduce the gap'? The easiest way, is to reduce the number of kids taking academic courses. Think of it this way. Students in the high end of the applied courses, will naturally pull up the achievement rates for that group. But if these same learners are in the academic courses, they are more likely to pull down the results of that group, all while leaving the applied courses with fewer successful students.
So, if a school hides its modestly talented math test-takers under the shell of applied courses, then both the applied and academic classes are more likely to have higher passing rates. The academic courses will be filled with mostly high achieving math students, while the applied courses will benefit by having more students capable of passing the test.
Sure, we'd be increasing the gap within the applied courses, but we'd be decreasing the gap in the academic courses, and the resulting EQAO statistics might well make school administrators blush.
A Test Question?
Maybe this is just the type of 'authentic' math problem that should be on the EQAO test. My guess is that a few bright students would teach the system to spit out high enough passing percentages, that future students and teachers could save themselves from the stress of the test.
Photo credits: find x by dullhunk; bridge by Malcolm Surgenor
But too often, it's the gap that matters. While ignoring or impeding the learning of our brightest students is one way to decrease the achievement gap, there is another 'mathematical' way to bridge the difference: Play the shell game.
In the province of Ontario, students enter either academic or applied streams of courses in grade 9. The academic courses are designed for kids who got the 'I do school well' gene; while the in theory, the applied courses are meant for learners who do better with concrete learning experiences. Locally developed courses are provided to meet the needs of students with functional deficits or intellectual challenges well beyond those of the average student.
When it comes to measuring achievement in mathematics, the Education Quality and Accountability Office or EQAO, tests HS students in grade 10. The results are reported for both academic and applied streams board by board, and school by school . So each school gets a report highlighting the percentage of learners who were successful in each type of course.
Want to 'reduce the gap'? The easiest way, is to reduce the number of kids taking academic courses. Think of it this way. Students in the high end of the applied courses, will naturally pull up the achievement rates for that group. But if these same learners are in the academic courses, they are more likely to pull down the results of that group, all while leaving the applied courses with fewer successful students.
So, if a school hides its modestly talented math test-takers under the shell of applied courses, then both the applied and academic classes are more likely to have higher passing rates. The academic courses will be filled with mostly high achieving math students, while the applied courses will benefit by having more students capable of passing the test.
Sure, we'd be increasing the gap within the applied courses, but we'd be decreasing the gap in the academic courses, and the resulting EQAO statistics might well make school administrators blush.
A Test Question?
Maybe this is just the type of 'authentic' math problem that should be on the EQAO test. My guess is that a few bright students would teach the system to spit out high enough passing percentages, that future students and teachers could save themselves from the stress of the test.
Photo credits: find x by dullhunk; bridge by Malcolm Surgenor
Sunday, September 16, 2012
Creating a Community QR Poster
One of the first community publishing projects we undertook in my 'learning strategies' class, was to produce a large QR code that will eventually hyperlink to our class website. Our poster will be 29 pixels square to match our master QR image. If your students use one inch pixels, the group will produce an image almost two and a half feet wide. (Our final poster will be a bit larger than that.)
Step 1: Create a QR code that links to a classroom web page. I used MobileFish QR Code Creator because it allows the user to specify the size of the first printed image.

Step 2: Decide on a way to cut the code into pieces so that each student can take on a part of the project. With 16 high needs students in my class, I began our project by breaking our code into 16 equally sized unique squares.

Step 4 (Option 1): Provide each student with a piece of the puzzle. You might elect to print a puzzle grid template on which each student might recreate his/her pixels. Just make sure the grid is filled with enough fairly precise squares.

Step 4 (Option 2): As an alternative, you can simply have each student produce a set number of dark squares that can be added to a master grid by a select team of students. So long as the black pixels are composed of images that appear dark when viewed from a distance, the code should work.
Step 4 (Option 3): Instead of puzzle pieces, cut your QR code into strips, providing each student with a binary strip composed of black and white squares. This solution would work wonderfully for a class composed of 29 students!
Step 5: I asked each student to complete images that represented their favourite things, their talents, and their goals for this school year. For some, it took a long time to develop a list of words or icons that could most apty represent each individual's uniqueness. (It took even longer for students to produce clean dark images with black Sharpie pens.)

Step 6: Put it all together. With our QR puzzle being completed on a part time basis, we hope to have a final poster ready in a week or so.

Community projects like this one call for each student to demonstrate some commitment to the collective. The resulting symbol demonstrates to others that the unified group is made up of many uniquely talented individuals. While we used hand-drawn sketches, I'm confident that a similar project that uses coloured squares of paper, photographs or images cut from magazines, can yield a similarly effective symbol of class unity.
Step 1: Create a QR code that links to a classroom web page. I used MobileFish QR Code Creator because it allows the user to specify the size of the first printed image.

Step 2: Decide on a way to cut the code into pieces so that each student can take on a part of the project. With 16 high needs students in my class, I began our project by breaking our code into 16 equally sized unique squares.

Step 3: Enlarge each student's piece of the puzzle so that the individual pixels can easily be seen and organized. I enlarged each of the pieces to fit on full sheet of letter-sized paper.

Step 4 (Option 1): Provide each student with a piece of the puzzle. You might elect to print a puzzle grid template on which each student might recreate his/her pixels. Just make sure the grid is filled with enough fairly precise squares.

Step 4 (Option 2): As an alternative, you can simply have each student produce a set number of dark squares that can be added to a master grid by a select team of students. So long as the black pixels are composed of images that appear dark when viewed from a distance, the code should work.
Step 4 (Option 3): Instead of puzzle pieces, cut your QR code into strips, providing each student with a binary strip composed of black and white squares. This solution would work wonderfully for a class composed of 29 students!
Step 5: I asked each student to complete images that represented their favourite things, their talents, and their goals for this school year. For some, it took a long time to develop a list of words or icons that could most apty represent each individual's uniqueness. (It took even longer for students to produce clean dark images with black Sharpie pens.)

Step 6: Put it all together. With our QR puzzle being completed on a part time basis, we hope to have a final poster ready in a week or so.

Community projects like this one call for each student to demonstrate some commitment to the collective. The resulting symbol demonstrates to others that the unified group is made up of many uniquely talented individuals. While we used hand-drawn sketches, I'm confident that a similar project that uses coloured squares of paper, photographs or images cut from magazines, can yield a similarly effective symbol of class unity.
Sunday, September 9, 2012
UnPlugd 2012: Assessing the Unmeasurable
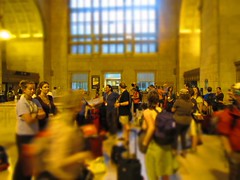
When it comes to digesting a good meal, a sense of satiation triggers positive feelings. In a similar way, participants engaged in our unique unplugged learning adventure, left UnPlug’d with a feeling of fullness, refueled by deep conversation, nourished by rich natural meals, and refreshed through recreation amid the splendor of Ontario’s near north. While we can measure the success of our event by pointing to the product that we produced, many of the hidden benefits our event, are intangible and immeasurable.
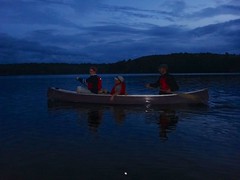 How can you summarize the effectiveness of a collaborative writing venture that brings to life the narrative experiences of a diverse group of co-authors? How can one measure the value of a journey in a private rail car filled with kindred spirits? How do you put a value on the achievement of emboldened colleagues who succeeded in their cross-lake swim to an iconic tree on a nearby island? How might you assess the experience of once distant friends sharing their passion for running by connecting for a morning run amidst the wonder of Algonquin region? How can anyone measure the magic of an evening paddle to a sauna, swim and campfire, when capped by the shooting stars of the Perseid meteor showers? Is it even worth considering what it means to hold in your hands a guitar that is made up of historic artifacts from across Canada or what it feels like to hear that same guitar played at a campfire or at a private indoor gathering?
While educators had to take up the invitation to participate in UnPlug’d 2012, it was through generous sponsorships and donations from a number of Canadian and US EdTech companies, that we were able to set the conditions for a rich and memorable event. We are indebted to many partners who supported our mission to dig into our collective memory, to share experiences with distant colleagues, and to edit and publish our most impassioned ideals.
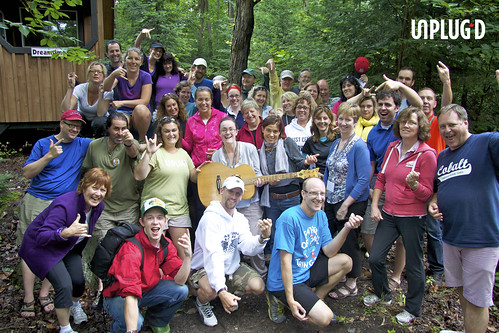
UnPlugd’d participants continue to talk, share, and collaborate by leveraging social media tools, and by gathering for face-to-face meetings and professional development events. Through open conversations on Twitter, and through deeper reflection on personal blogs, participants continue to reflect on their experiences, to consider adaptations to their professional practice, and to lead by learning in public. As our multimedia publications near completion, the dividends from UnPlug’d 2012 are sure to impact connected teacher-learners from Canada and beyond. We invite you to consider coming along for the ride at unplugd.ca.
Image credits: Rodd Lucier, Lisa Neale, Todd Lucier,
Many more images are available in the UnPlugd12 Photo Pool
This article was originally written to appear in the MindShare Learning Report.
This article was originally written to appear in the MindShare Learning Report.
Wednesday, August 15, 2012
UnPacking UnPlugd12
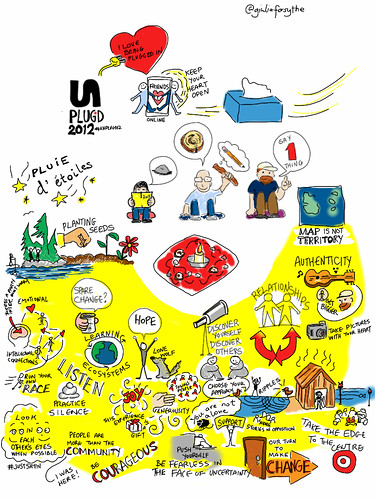
After an amazing time on the Edge of Algonquin Park in Ontario, we've begun to unpack a lot of things... the most important of which, aren't things, but ideas. The concept map below was drawn by Giulia Forsythe, one of the small group facilitators at this year's event. The sketch reflects the many takeaways identified by participants at our final large group circle at UnPlugd12.
Incidentally, this is not the only awesome image Giulia has created. Beyond her unique ability to represent ideas in doodles, she is also an avid photographer. In fact, one of the images she captured from UnPlug'd 2011 was used as the basis of the postcards being shared by this year's participants. You can imagine my chagrine when I learned that I failed to attribute this photo when creating the postcards. I'll make it up to you somehow Giulia. :)
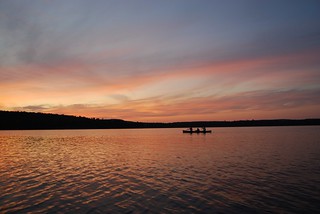
These images and many other wonderful images by Giulia Forsythe are licensed for use through Creative Commons.
Subscribe to:
Posts (Atom)